DURAClone IM Phenotyping Basic Assay Performance
The intrinsic variability in biological material and the instability of samples can make flow cytometry assays prone to variability. Adding to that the requirement for instrument set up and standardization of acquisition settings as well as operator variability and variability in analysis of complex data outputs means that flow cytometry assays are prone to variability. Robust panel design and reduction of error prone steps can increase the reliability of the method.
Commitment to quality. Beckman Coulter fully characterizes the quality of our reagents. Multiple lots of each reagent are tested by multiple operators to determine the recommended ideal antibody concentration per test, robust incubation times and the variation of staining results within and between lots. Each new lot is evaluated to ensure that established QC parameters are met.

Precision. Peripheral whole blood was collected with EDTA as an anticoagulant from 3 normal donors and were stained in 10 replicates with a single lot of DURAClone IM Phenotyping Basic antibody panel. Populations were quantified as % of the respective parent gate (e.g. a lymphocyte gate). The range of values obtained within a series of replicates is represented by the respective 95% confidence interval, illustrating the tight ranges of values obtained for each donor.
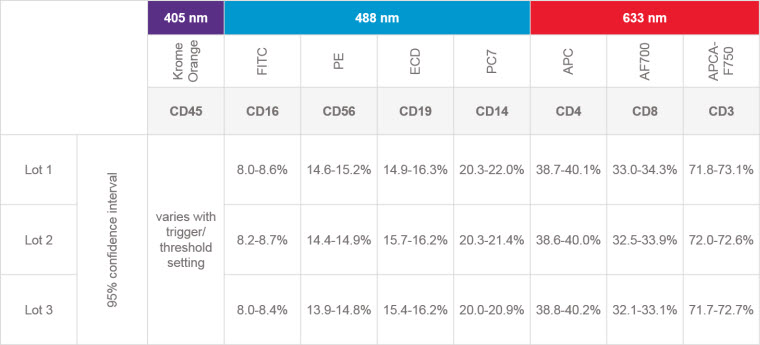
Lot-to-lot Variation. Peripheral whole blood was collected with EDTA as an anticoagulant from a normal donor and was stained with DURAClone IM Phenotyping Basic antibody panel using 3 different production lots in 10 replicates each. The relative proportion of positive cells for a given marker were quantified as a % of the respective parent gate (e.g., a lymphocyte gate). The range of values obtained within a series of replicates is represented by the respective 95% confidence interval, showing consistency across different reagent manufacturing lots.
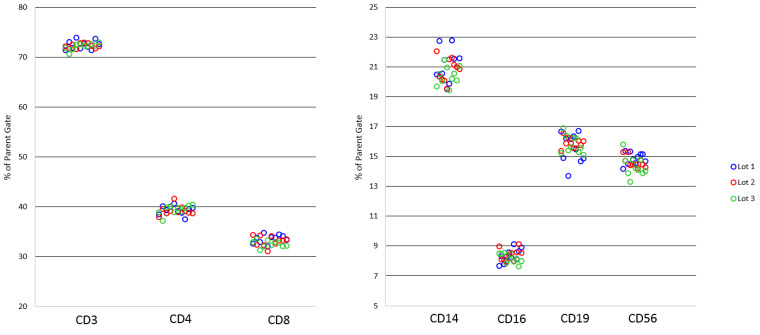
Data Clustering. The graphical representations illustrate the narrow clustering of the measurements used to calculate the 95% confidence intervals.
